A solid foundation is needed for any serious endeavor. We recommend strongly, that you get that from the book and the home- study course. We have also provided dozens of full free tutorials to increase your understanding. Give yourself something solid to build upon.
Learn to set your own scans with our tutorial on Tc2000®Easy Scan .
Learn with our products
Wind to our Backs! Rolling Stocks
Some stocks will roll back and forth within a channel, between a high and a low price. Once a stock is identified it should be easy to buy low and to sell high.
“Buy low, sell high!”
That is always good advice for a would-be successful investor. It is also quite useless since we never know exactly where the highs or the lows will be. However, with the computer tools available today, it is much easier to reduce the risk and to anticipate potential stock price moves. Armed with this information, rolling stocks that move between predictable channels can serve to fatten our bank account. Suppose we had invested $1,000 in General Electric in 1988 (260 shares) see Fig. 1:
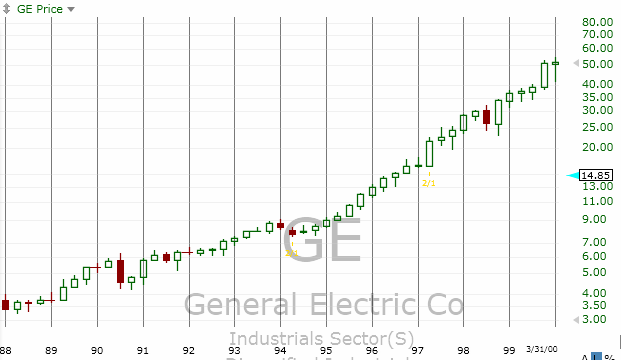
Fig. 1 General Electric (GE)
Case 1. Buy & forget ’til we sell in 2000 (~12 years later):
Buy 6/1/88 @ 3.87, Sell 1/1/00 @ $49.52, for a return of $12,800. Let’s see, that is about 1280% return in 12 years!
That’s not bad! That is why our parents and grandparents were so hooked on “Buy and Hold!” Multitudes of retirement plans were funded by that type increase. But let’s see what’s happened to GE’s stock price later in Fig. 2.
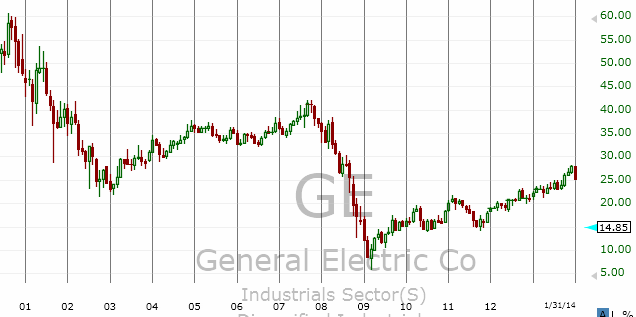
Fig. 2 General Electric since 2000.
Case 2. Buy & forget $1,000 on 1/1/00 @ $49.52 (20 shares).
On the date shown the price for GE is $24.05 and our investment is worth $481.00. That’s a 50% decrease in 12 years!
To illustrate, take just a portion of the last ten years, say from 2004 to 2008 and exercise the Trader skill for comparison. Working only the flat portion of the above chart (between ’04 and ’07), the trader looks to capitalize on both the up-moves and down-moves during this time frame. Opportunities to capture short gains on good rolling stocks are shown on Fig. 3.
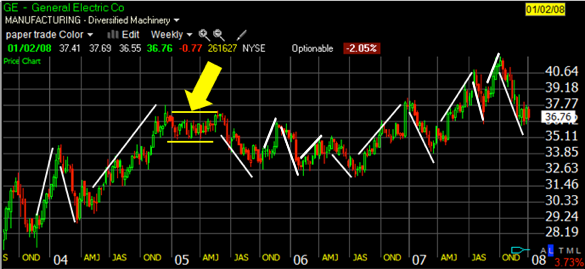
Notice that trades were taken in both directions, shorting stocks on the downside and going long on the up. Fourteen such trades are shown, which if maximum gains were made, our $1,000 initial investment increased to over $3,300 (230% in four years). Of course we won’t capture all that gain, but if we captured half the potential we would end up with over $1,600 (60%). Compare that with the Buy & Hope return over the same four year period of -50%. The purpose here is to show the potential for higher returns on stock purchases by working the “rolling” nature of some rolling stocks. Notice the yellow highlight on the previous chart. This is a consolidating stock pattern with no noticeable trend. Stock patterns spend roughly one third of the time in sideways patterns such as this. It is a time of indecision, with buyers and sellers in some balance, happy with the status quo. Stock patterns such as this are often called “Rolling Stocks.” Finding stocks that “roll” and choosing buy-sell signals to produce cash flow is the point of this guideline.
So how do we take advantage of this rolling stock strategy (some call it “Surfing” or “Channeling” the market)?
ROLLING STOCKS:
Read about the two handicaps that must be overcome using “Rolling Stocks” in Chapter 2 of our book: “Provident Investing.”
Rules:
-
Select stocks from a price bar-chart that show a pattern of roll’s within some channel, between a low price (bottom of the channel, called Support) and high price (top of the channel, called Resistance).
-
Select preliminary Buy and Sell signals at conservative points and estimate a rate of return:
Return(%) = (Sell Price – Buy Price)/(Buy Price) x 100
If the calculated return is less than about 6%, don’t waste your time.
-
Before buying a stock at some low price, define an exit on the upside, or “When are we going to sell!” (Keep your head, don’t try to beat the return you calculated above) We also need an exit strategy in place on the downside, that is, if the stock refuses to roll up after we buy, how low will we let the stock fall before bailing out.
-
One suggestion on the downside is to put a stop-loss at 30% below where we bought in, another suggests 50%.
-
William J. O’Neal, founder of the Investors Business Daily, uses 8% as his stop-loss on all his investments. He says very simply his risk is always limited at 8%.
-
That may be tight with rolling stocks, since we expect more volatility than we would tolerate with a growth stock. We must find a level we are comfortable with and realize that this is an insurance measure. We can’t feel bad when we bail-out at our down-side stop on a stock that stubbornly won’t roll up again, and then does go back up.
Discipline!
-
When a stock price is decreasing to its support level, don’t buy just because it reaches your predetermined “buy” point. Wait for the price to kiss that support level and start back up. Never put a Good til Canceled (GTC) order to buy the stock as it decreases. (I’ve watched too many rolling stocks just keep going down after buying when the price has reached my buy point)
-
A GTC order is okay as the stock is rising toward its sell signal. In fact, this is a good way to maintain the upside exit rule. In addition, a GTC on the upside can help us catch a momentary blip that we would miss unless we sat at the computer all day watching the stock movement. Not a very pleasing prospect.
-
Confirm the value of a rolling stock with fundamental and technical analysis before jumping in. Don’t buy just because it’s low-priced and appears to be on the down cycle.
-
Common sense is an important feature in successful trading. It is our ability to look at a situation and make judgements that separates us from the animals. It also separates us from the “black box” that would suggest the computer make all our decisions:
-
If a stock looks strong as it moves up to our sell point, we can choose to cancel our sell order and hold the stock as it moves beyond its resistance level. The stochastic technical indicator can help us make that decision.
-
We can also let our better senses tell us to sell a stock if it looks weak before reaching our chosen “sell” point. The ability to do this successfully comes with experience. It is more important initially to become familiar with a set of rules to stick by and get our experience conservatively.
-
Since we know that rolling stocks will go back down, we must strive to to sell the stock before it does go down. Our entry & exit rules, that is our strategy for dealing with rollers, makes it clear we bought the stock to sell at a profit.
-
Use the Stochastics to guide in buy and sell decisions on good rollers.
-
Rolling stocks are not eternal. Each identified rolling stock has a shelf life and will stop rolling. We cannot set our buy & sell signals with the computer and then go sit on the porch. Rather, it takes a lot of work, daily review of the status and then decisive action as we follow the rules for our strategy.
-
-
Other personal matters to minimize risk:
-
Consider the size of the company, measured by its capitalization (There is just less risk with a larger company).
-
In the same vein, higher daily volume also means less risk. If your choice is between two stocks, pick the one with higher average daily volume.
-
Most good rolling stocks settle into a rolling pattern as a result of a decline from a higher trading range. This is a powerful signal to help you spot an emerging roller.
I’ve traded rolling stocks since the late ’90s with a watch-list of potential rollers, updated weekly with a rolling-stock scan. Following are tickers recently flagged as potentials.
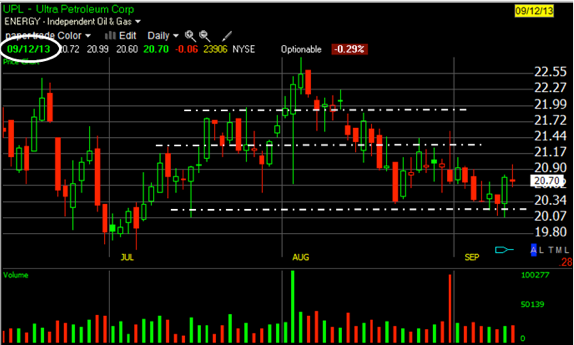
1a. This ticker (UPL) looked good (Fig. 4a), ready to roll up to some resistance level. It is unclear what that resistance level will be, with two options shown with the white dashed lines. It could even be the peak ($22.60), but that is unlikely, so far back. Here is what it did:
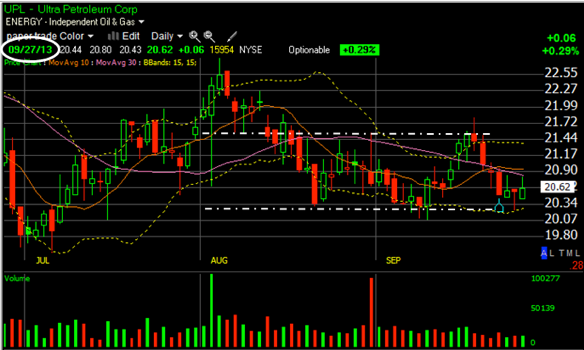
1b. While this is a good looking roll, Fig, 4b, the price change is only a 7% potential gain, if we got in at the very bottom and out at the very top.
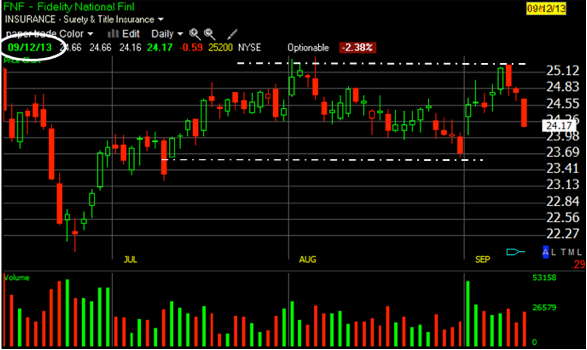
2a. Fig. 5a (FNF) shows a good channel (8%) but is now in the middle, suggesting we wait a bit to see where it goes.
2b. The next day brought a big surprise (Fig. 5b), punching up the value of Candlestick principles:
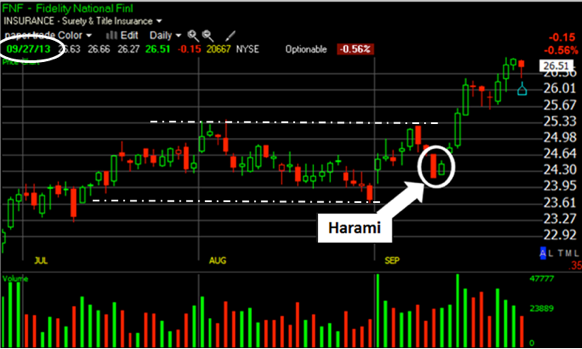
Fig. 5b FNE with a standout Candle pattern called the “Harami.”>/div>
3. The definition of a Harami is copied from our recent Candle Corner Guideline:
“A Harami occurs whenever a long day is followed by a shorter day of opposite color. The open and close prices designate if the second candle satisfies the requirement. That is, the shadows are not relavent. A bullish Harami (Fig. 6a) has had a downtrend in place for some time with the latest candle in the downtrend is followed by a shorter bar of opposite color. The Harami definition requires the open and close of the white candle be within those of the preceding black candle. The opposite can be said about bearish Harami in Fig. 6b. In this case, the increasing trend is shocked by the reversal and provides a turning point in the pattern.”
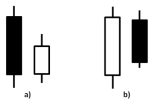
Fig. 6 Harami
4. The message of a Harami is potential trend reversal. Look at Fig. 5b above to see how that Harami played out. An alert trader would have positioned him/her self to take advantage of the potential price increase. (with appropriate money management steps for risk control)
5a. GXP has dropped from a $24.00 high and has flattened out, signaling a possible trading range. Let’s see what it did?
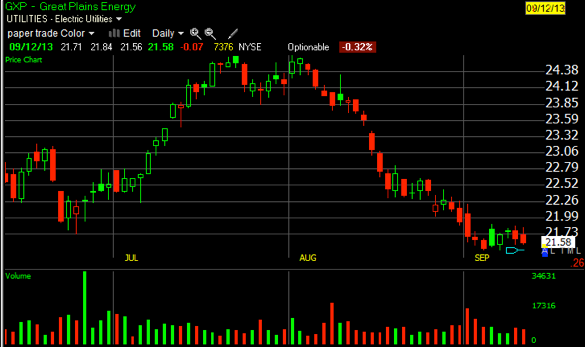
Fig. 7a GXP moving to a potential roll.
5b. In this case the plan worked out with a decent roll being formed as shown in Fig. 7b. This ticker is one to watch (roll 6%).
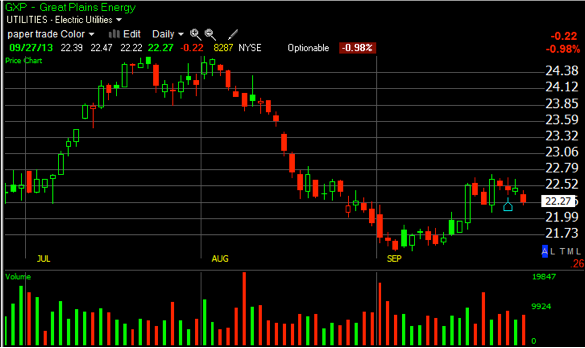
Fig. 7b GXP moving into a positive roll position.
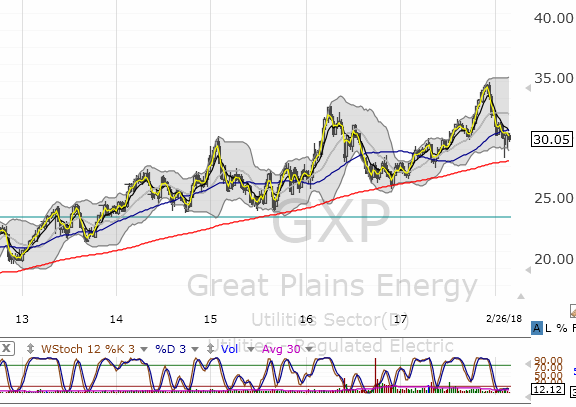
6. Many good rolling stocks settle into a rolling pattern as a result of a decline from a higher trading range. This is a powerful signal to help you spot an emerging roller
Look at the profitable rolls this stock put together since!
You will find a link to our tutorial on Worden’s ®Easy Scan. It is also offered in Products. Learn with our products
Using it with https://www.tc2000.com/ or http://Freestockcharts.com, you will learn to set your own scans. This will greatly reduce your time searching for the best possibilities.