Learn with our products
Provident Investing book, and course opportunities.
TSV – A proprietary technical indicator developed by Worden Brothers, Inc., TSV is an oscillator, calculated by comparing various time segments of both price and volume. The indicator measures the amount of money flowing into or out of a particular stock. Its value varies above and below a zero line, somewhat like the familiar Stochastic. When TSV crosses up through the zero line it signals positive accumulation or buying pressure. This is bullish action. When TSV crosses below the zero line it designates distribution or selling pressure. This is bearish action, typically preceding a move down in price.
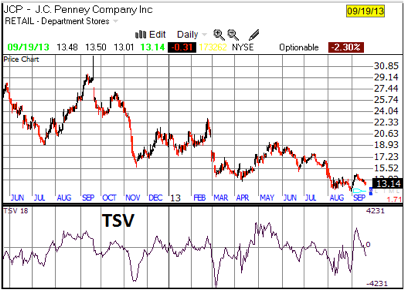
Fig. 1 TSV shown with Price pattern.
Another important thing to look for when interpreting TSV is a contradiction of trends between price and TSV. Look for positive or negative divergences between price and TSV in order to determine potential tops and bottoms. Several consecutive divergences increase the reliability of trying to identify price reversals. For example, if price has been making successively higher highs while TSV has been making successively lower highs, this would constitute a series of negative divergences. This would indicate a possible top. In Fig. 1 above, there are no significant divergences, rather the TSV follows the price as it normally will.
Notice the scale on the TSV – it doesn’t matter! The value is not important, rather the shape and direction (slope) contain the messages. There is no quantitative way to compare price and TSV. TSV is an oscillator. But when it goes up while price falls, the message is very clear. Just don’t worry about measuring it.
The broader the span of a TSV divergence – the more important its implications. Thus, if the price trends down over a week or two, while TSV trends up, that’s good – but not as favorable as if the divergence took place over a couple of months. In the latter case, you could expect an important advance. Divergences are among the most useful of technical observations. They tend to be more reliable than most other observations available. This is because divergences are unnatural. Going against the grain is always more noteworthy than going with the flow. Anyone can paddle downstream. But the guy who can paddle upstream must be stronger. By paddling against the current, he tells us much about himself.
Lets see an example: Telechart 2000 is Worden’s proprietary software package that makes all this possible. The stock chart shown (PRTA) has the TSV indicator shown as the black line moving from the top left down to the right. A Linear Regression line (15 bar) of that indicator (TSV LR) is plotted in Red. The same 15 bar LR in Blue for the Price slopes up. Compare the symmetry of the two LRs. Very simply, Price is sloping up while the TSV is sloping down. That is a negative divergence!
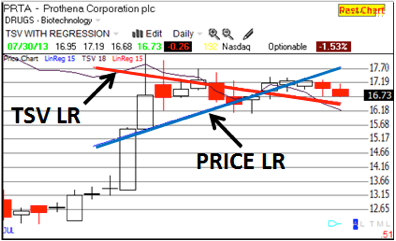
Fig. 2 Price/TSV Comparison
One of the greatest assets in the TSV indicator is its ability to contradict price action, to diverge, suggesting a change in the price pattern. The slope of the price Linear Regression line suggests price will continue upward, but the TSV tells a different story, a change may be ahead. Look at the next chart to see where the price went.
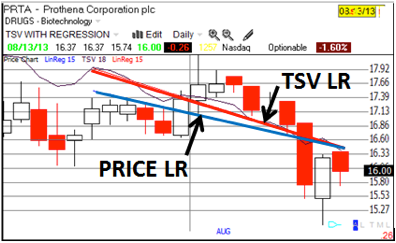
Fig. 3 Subsequent price action for PRTA.
The Price/TSV divergence in the previous two charts demonstrate how TSV can forecast a diverging price pattern. In this case, the negative sloping TSV LR suggested a price decrease, which it did!
Figure 4 fulfills the TSV message, paddling upstream for higher prices. Notice the subsequent TSV signal dampens the enthusiasm.
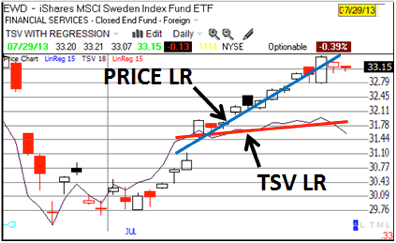
Fig. 4 Price/TSV messages.
What’s more important is the fact that TSV divergences work across all time frames, from intra-day to monthly patterns. Where does the TSV suggest price is going in this monthly chart (STRA)?
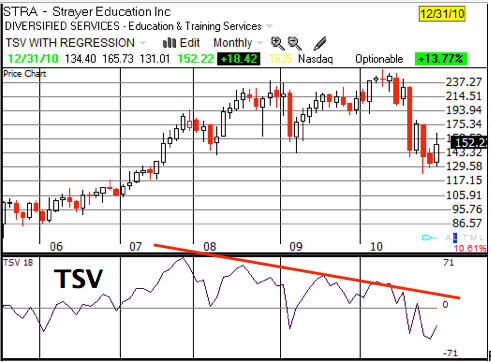
Fig. 5 Monthly price chart STRA.
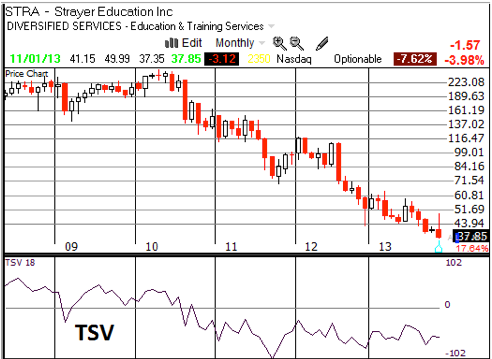
Fig. 6 Decreasing price pattern (STRA) forecast by TSV.
We need to develop the ability eyeball divergences, an easy statement but one that needs a lot of time and practice. In the meantime, we can use Linear Regression lines with TSV and price in the same window, like the early figures in this post. It is easy enough to eyeball a stock that has been trending down for a few months. Then look for the lowest point it has reached. What you want to determine is if there is a divergence at the lowest point. That means, did the TSV profile come down to that point, or did it come up to that point. If it was going up before it got there, you have a positive divergence. If not, the is no divergence.
The fact is volume is the ONLY leading indicator we have to work with, all others depend on what the price has done, lagging in time. It is the inclusion of volume segments in the calculation of TSV that gives it such predictive power. This is not the case with other oscillators, e.g. Stochastics, et al. When TSV goes one way and price goes the other, they are said to diverge. And that phenomena sends signals about where price is likely to go!
Like the disclaimer always says, past performance is no guarantee of future results, or something similar. IT DOESN’T ALWAYS WORK! This is not science, but more a game of estimation and guess-timation. If you observe that TSV is stronger or weaker than the price trend, that’s about all you can learn, and that is where you start thinking and taking chances. The indicators and/or the price won’t tell you with any certainty whether you’ve guessed correctly. If you can’t force yourself to take risks based on partial knowledge, trading may not be for you. For example, look at the next chart on TITN and make your decision. Yea or nay?
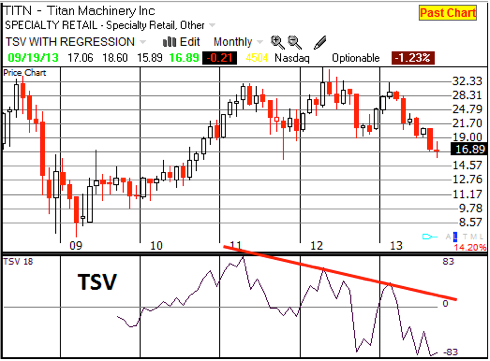
Fig. 7 Current monthly price chart. Would you take a long position here?
Note: Many other TI’s are available to help us get into and out of positions ahead of the crowd. When Worden’s TC2000 indicators are properly used in concert with other indicators shown on the Master Overbought/Oversold Indicator Summary in chapter 5 of “Provident Investing,” you have real power!
This series on technical analysis will help you each find a new understanding of what it takes for success in the market and the confidence to take action. There are no certainties, no magic bullets, schemes or system that will allow us to escape the risks of the market place. All any of us will ever have are educated guesses about what a stock will do next. It is the level of that “educated” guess we are trying to improve, increasing the probability of success.
In the real world we can’t know with certainty what direction a stock will go, but we must have an opinion, a hypothesis, for only in trying and in having success or in making a mistake will we ever learn life’s (or the market’s) lessons. It has been said that trying doesn’t increase the risk, it reduces it. May we find joy in our efforts.
- Be diligent, take action… SiteMap
The best things in life are NOT free!
Time Segmented Volume, TSV are registered trademarks or trademarks of Worden Brothers, Inc.