Volume – As an indicator, and what it is showing us, is primary in making selections in trading.
Learn with our products
HOW DOES VOLUME FIGURE INTO YOUR TRADNG?
There was a time when volume data wasn’t available until a day or days after a trade. But in today’s electronic age, live volume is at your fingertips. The beauty of volume as an indicator in live trading is the fact that it is the ONLY leading indicator among the hundreds of possibles. Everything else derives value from what price is doing, lagging the price action. That means changing volume can impact what price will do before it happens.
Volume plays such an important role in our trading we should not neglect the messages it sends. For example, the key to this important strategy is the function of volume spikes. It these spikes that suggest possible market turns. The chart below show a recent shot of the SP-500 index clearly demonstrating how volume spikes foretell changes in the very recent trends. This is a weekly chart used to provide a larger picture of the action.
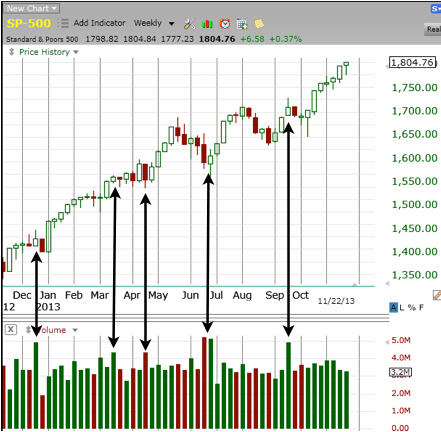 Fig. 1 SP-500 Weekly Price-bars with Volume.
The same phenomena is present in Daily price bars as shown by the next graphic on a single stock pattern.
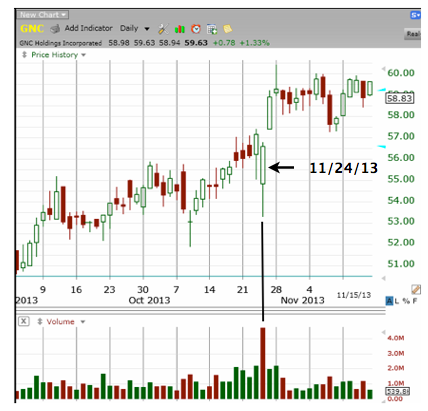 Fig. 2 Price and Volume action on GNC.
To make the graphic clear, look at what the price bar did on that day (11/24/13). The volume bar is red because the price closed lower than on the previous day. The price bar on that day is open (green) since the closing price was greater than its open. It was internally an up day, though it was not as high as the day before. From a “top of the trees” perspective, the market was down on that day. But the dramatic volume spike suggested a change was in the works. Volume does send messages!
Let’s examine the day highlighted to better understand what took place on that day. Look at the following 30-minute chart on that same day (11/24/13).
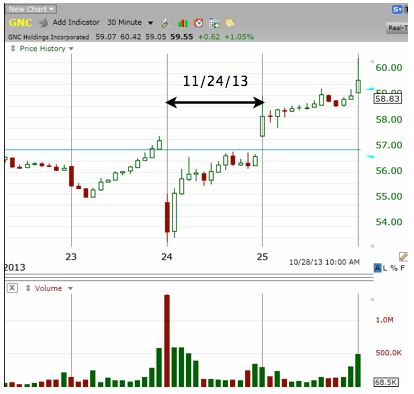
Fig. 3 Daily Volume action on GNC price bars.
The day opened on a serious gap-down, which was the greatest volume spike during that half-hour. Sellers were in control unloading large numbers of shares. This usually occurs when retail traders (you and I) sense trouble and begin to sell at the same time. Notice, the three Red days in Fig. 2 preceding the dates in question, prompting the high volume selloff. When enough small traders do this at the same time, as happened in this instance, professional traders storm in to take advantage of the low prices to fatten their portfolios.
This scenario is repeated continually in the market, with volume providing important clues.
The story is repeated on charts of any time frame, weekly to intraday. The message volume sends is very important to your trading plans but should not take the place of other indicators that have worked well for you. It is but one indicator, used as a general warning of a potential change in the direction of the market.
“Volume confirms the price trend. If both are moving up together, the uptrend is healthy. However, if prices are moving higher while the volume line is dropping, a negative divergence exists, warning the price uptrend might be in trouble.” John J. Murphy
![]()