Learn with our products
Candlestick Emotions may give understanding that may light the way to greater profits!
We spoke of emotion in the auction market place and its influence on price. With the market composed of buyers and sellers, the collective emotion in these two camps plays a powerful role in both increases and decreases in price. Larry Williams, who captured this in his early writings, suggested the following graphic, letting market action (the price chart) show where the power lies:
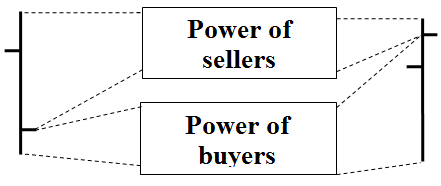
Fig. 1
The bar chart shown in Figure 1 can be replaced with candlestick patterns which have gained wide acceptance in the trading community over the last couple of decades. Virtually all charting packages now include candleticks as an option.
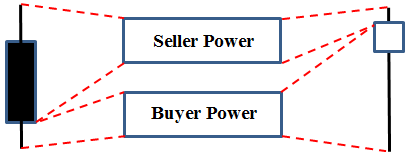
Fig. 2
The price swing from the high of the day to the close in any time period (weekly, daily, etc.) represent sellers, while the power of the buyers rests in the close minus the low. The candlestick graphic is more descriptive than the bar, although they both say the same thing. Let’s look at a few candlesticks and see why they’ve become popular among traders. The candlestick format is explained in detail in chapter 1 of our book, “Provident Investing.”
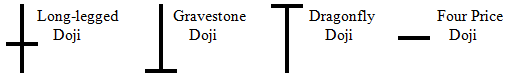
When the body of a candle line is so small that the opening and the closing prices are equal, or very nearly so, they are called Doji lines, Fig. 3.
Doji Patterns
Fig. 3
Each of these four examples represent different sets of emotions during the trading period. The long-legged example reflects the indecision of the buyers and sellers. The market moved higher, then lower during the period, unable to come to any conclusion.
The Gravestone Doji: Japanese Candlesticks are based on various analogies, in this case the graves of those who have died in battle. In the trading sense, this day’s activity can only be a failure to rally.
When the open and close remain together at the top of the trading range, this often occurs at market turning points. When this occurs at the end of a downtrend, it is considered extremely bullish.
The last Doji in our example is very rare, occurring with total uncertainty by traders in market direction.
Because emotions are fleeting things, in the turbulent market place, candlesticks provide much more value to traders than to investors. Understanding Candlestick Emotions is facsinating and helpful. Investing is driven basically by fundamental considerations while candlesticks are short-term trading tools to fine-tune entry and exit decisions. Candles provide very little help to long-term investors.
That said, from the trading platform, candlesticks provide an immense advantage. The big picture view in Fig. 4 shows the following pattern gives us what we’d expect. Moving averages frame the price pattern telling us, in retrospect, where price action has taken place.
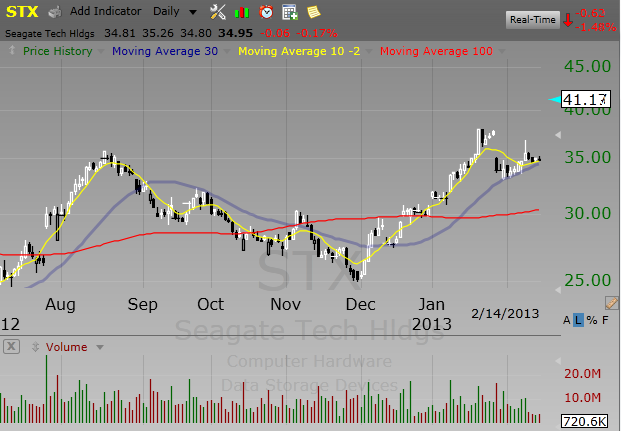
Fig. 4
But notice the negative 10% gap that occurred on January 29. There is a very bullish white candle five days before the gap, followed by a black candle and three very “short” days with reduced volume signaling indecision. See FIgure 5.
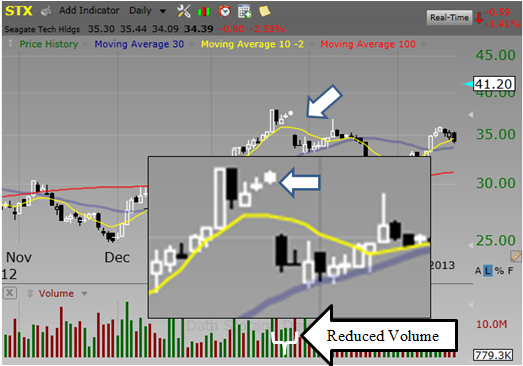
Fig. 5
A small or no-body day sends a very specific message. Small bodies very accurately predict indecision. The outcome may be in either direction, but the lack of momentum is always a clear message.
Since turns in price patterns must always lose traction and stop before changing direction, the turns are very deliberate. Very often, the turn is punctuated by an indecisive day or two. This puts the trader on his/her toes as shown in the price chart of Fig. 5
Market insights from Larry Williams (“Long-term Secrets to Short-term Trading” – Wiley 1999):
“What you don’t want to do is catch falling daggers, you wait until they stick in the floor and stop quivering, then and only then do you pick them up. That’s the best lesson I’ve learned in over 50 years of watching people lose money.
For short-term traders, I took this to mean that I should not try to buy market sell-offs, should not stand in the way of freight trains. I lost lots of money thinking I could tell when price had “bottomed” and would turn around for the day. My early trading accounts are pretty convincing proof that I could not perform that magic. I eventually learned not to try to pick tops and bottoms.
You have been aware that every day there is a battle between buyers and sellers; now you know how and where to look for the buyers and sellers. More importantly, you have learned about shifting relationships; that the higher the close is on the bar the closer we are to a top, while the lower the close is on a bar, the closer we are to a bottom. Here are two of my rules:
-
Most all market highs can be found to occur at or shortly after a market closes right on the high of the day.
-
Most all market lows can be found at or shortly after a market closes right on the low of the day.
The closer the daily close is to the high of a bar, especially if there are several such bars together, the closer we are to a market high. Market lows, in all time frames are just the reverse: the closer the closes of the bars are to the low then the closer we are to a market turn.”
“The appearance of things change according to the emotions and thus we see magic and beauty in them, while the magic and beauty are really within ourselves.” Kahlil Gibran
We offer a tutorial on TC2000 Easy Scan®, that will help you set your own scans, to save time and ferret out possibilities for more profits. You will use this with TC2000 or Freestockcharts.com
Learn with our products
Candlestick Emotions is one tutorial. You will find other tutorials to increase understanding.
In a word – INSIGHT!