Learn with our products
What is the Reward/Risk Ratio?
We all face risk every day of our lives, driving to work, flying to destinations, drinking the water provided by our cities, investing in the market… In some cases the risk is so high we avoid the experience. We all have our own level of risk tolerance, the point where we intentionally avoid the experience. But our tolerance for risk shifts as the benefit changes. How many people would buy lottery tickets for a buck each if the reward for winning were only 10 bucks? Not many, I suppose. So our risk tolerance depends on the level of reward. In the market, we use these two factors together, risk and reward, as a ratio, with the reward on top, divided by risk in the bottom:
Reward/Risk Ratio = Potential Reward/Potential Risk.
We should alI consider the R/R ratio before investing any money into a trade. Lets examine this ratio and how it is used in this Guideline. Experienced traders require some level of comfort before committing themselves to a trade. A popular R/R ratio is 2, that is, the Reward is twice as high as the Risk. Others use an R/R ratio as high as 3 or even 4. This is one factor in a trading scheme you must come to grips with, finding what works for you, something that becomes a default factor as you plan your trades. The Reward/Risk ratio is a way to stack the trading odds in our favor. Unless there is a high probability of a winning trade (reward), we should not take the chance with our money (risk). This is simply good money management! Consider the following example to see how we might use the R/R ratio:
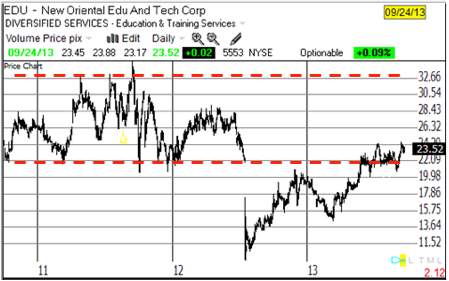
Fig. 1 EDU – A Chinese Education Company
Here is a stock that was quite volatile during 2011 and into 2012 before something serious happened. Since the catastrophe, the stock has made a valiant try in two jumps to recover its place between the red lines. Question? Since we’ve seen the price between $26.00 and $30.00, can we expect it to rise to that level again from its current price of $23.52? A $4.00 increase on a $23.00 stock would approach a 20% gain. Let’s look closer:
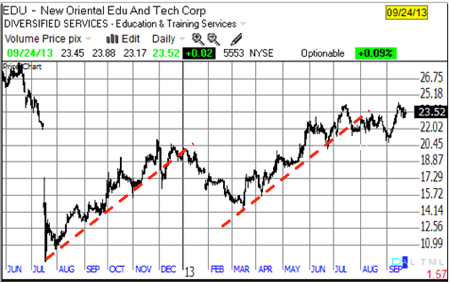
Fig. 2 Price ramping up with a pull-back.
Both of the up-trends would have made good trading plays had we entered correctly. But that is in the past, we’re now looking for a possible trade from where we are. Here is a closer look:
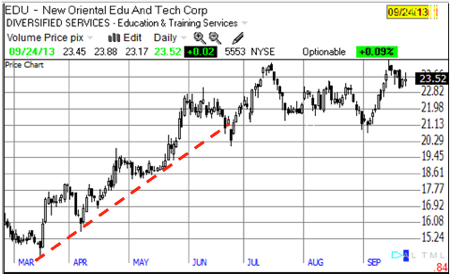
Fig. 3 An up-trend followed by a consolidation.
As we consider a trade on 9/24/13 we are now ready to put the Risk/Reward ratio to work. The next chart outlines some of the options facing us. The dashed red lines represent support and/or resistance levels, naturally occurring levels created by the mind-sets of all traders buying and selling shares of this stock during this time period.
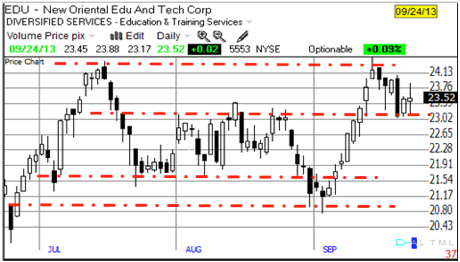
Fig. 4 Potential support and resistance levels.
Now, as we consider a buy at the end of this day (9/24/13), we look closely at a Reward/Risk before taking the action (set-up criteria before placing a buy order). Depending on our comfort level for an R/R ratio, we must look at our chosen stop level and the potential increase (Reward!). Risk = Buy Price less Stop, that is, what are we willing to give up if the trade goes sour? Depends a lot on what the reward might be, then compare the reward to the risk. In the table below, calculations are done on either an Excel or a Numbers spreadsheet, with the results shown: First, define a target increase for the trade, in our case we chose a price exactly in the middle of the previous action on Fig. 1, $28.43. Granted, its a guess, but the man said the best way to know what a price will do is look at what is has done.
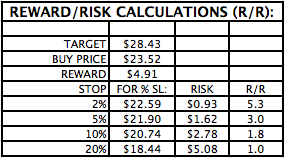
Fig. 5 Reward / Risk calculation.
A critical piece of the buy-setup requires a clear decision about how much money should we commit to the trade. The credible gurus who promote trading stocks all say 2% of our capital is the most we should ever risk, and many limit it to 1%. Let’s use the 2% limit to carry out this trade. If we have say $6,000 capital in our stash, then 2% ($120 is all we should commit. But our chosen stop loss defines the size of an order, in this way: $23.52 x Y shares = Total Commit! But our stop loss means we are not risking the Total Commit in the trade. If the stop = 5%, only 5% of that total is at risk. $120 / 5% = $2,400 at risk. With the stop price at $23.50, we can buy $2,400/$23.50 dollars per share or 102 shares. Round that down to 100 shares of EDU for the trade. We haven’t yet chosen a stop-loss for the trade, but looking at the options in Fig. 5 & 6, let’s go with 5%, or $22.33. This is what our trade looks like. And here is what the trade did…
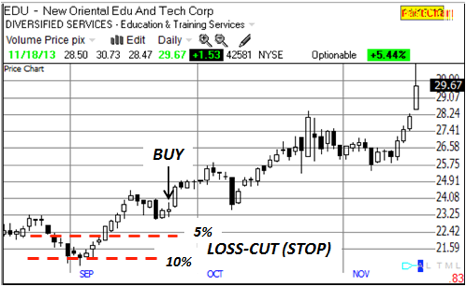
Fig. 6 EDU trade development.
Things fell into place the way we had hoped, returning 25% in two months. But notice, as price increased during these weeks we moved away from our stop protection. The answer is to increase the stop level as price moves up. Brokers will allow what is called a Trailing-Stop which moves up at some percentage of the highest price achieved, but it never decreases. Had we used a Trailing Stop on our trade but began with the 2% stop loss, we would have been kicked out on the large down spike in early October. You see, the trailing stop triggered by the high spike the third bar in October affected all price bars thereafter. What remains for heavy discussion is how to exit a trade, which is actually more important than the entry. To enter a trade we have 7,000+ common stocks to choose from, so we can be very selective in our choice. When it comes to the exit, our choices are limited to that one single ticker. Much more to come on exit strategies. You can see by this example there is a lot subjectivity as the trade is selected then developed. No guarantees! This is why the chosen stop level is so important, as well as each traders emotional profile. A stop is no good unless the trader has the moxie to follow a plan, to exit when the plan tells you to exit. And you will have as many losses as gains, likely more, so write your plan in such a way as to keep losses small and winners large. You don’t have to win more trades than you lose to profit in the market. Always use stops!
Chapter 6 in “Provident Investing” covers in detail the art of setting up a trade as briefly described here. This includes the method of determining the proper “Position Size,” based in part on the volatility of the ticker under consideration as well as your own personal risk tolerance. This is one of the least understood but most critical principles to successful trading! You cannot succeed without it!
What is the Traders Edge?
Insight!