Stock Selection – A Nightmare or a walk in the park?
Stock Selection is the fundamental, first-step, in trading and investing. In theory, stock prices should equal what is called the “Fair Market Value.”This, of course, is determined by stock fundamentals, with the myriads of factors that make up such an evaluation.Analysts, the “experts,” who know more about the stock than anyone else, deem some figure to be the “Fair Market Price (FMP),” upon which we base our buy and sell actions.This is a theoretical view point, IN THEORY!Millions of stock-pickers have taken this tack for years, which is one reason fewer than 20% come away winners.
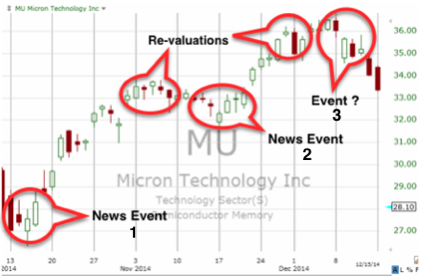
Stock selection? Easy, simply buy stocks whose price is below the FMP! Just buy when price is below that FMP and wait for it to rise.We’re told buy low, sell high.How tough is that?So we come upon this chart example mid-October where we read News Event 1, promoting an imminent rise in the stock price.Fast-forward three-weeks on this two-month snapshot of a daily price chart and enjoy its welcome rise for three weeks.
Fig. 1Market turning points.
On the chart above, Micron (MU), the price does rise as expected, some $4 (18%), where it slides sideways as the market slows to re-value the first week in November.Another positive News Event 2 kicks it another 9%, where it hovers during another re-valuation…It just can’t get any better than this.
But one morning in December you wake up to find your price down some 10%!You Google or Yahoo to see what happened, but there is no reason for the drop.Nothing in market news or a fundamental change to cause the drop.What happened?What is Event 3?Is there more to market valuation than just “asking the expert?”Could it be a conspiracy, with bags of money and dark glasses…?
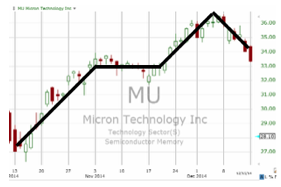
The problem lies in our expectation that this is how the market should work.Either consciously or sub-consciously, our gut takes us there.Because of this phenomena, many tell us we just can’t time the market, or we just can’t pick stocks, so buy in and let the chips fall where they may, making our money with clever action from inside the market.In theory, stocks should follow the straight black lines shown on Fig. 2.
Fig. 2
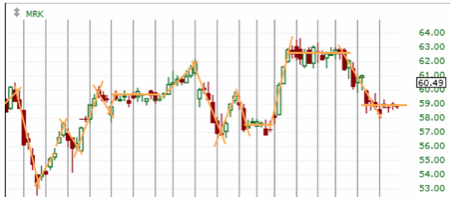
Actually, price patterns lookmuch more like the next figure, with prices following the orange lines, in a seemingly random fashion.
The truth of market behavior is like the random action of the orange lines below, not the black lines above in the previous figure.
Fig. 3
So, rather than asking the question, where are the stock prices going to go, how about a more practical question:
“What makes a stock price go up or go down?”
We can sum it up with one word, “Speculation.”This is the driving force, the energy that moves stock prices up or down.It is a market myth that says, stock prices move because of Fundamental factors.Rather, stock prices move up or down driven by Human Sentiment (even though it is often irrational)!
It doesn’t matter what makes sense, it only matters what is happening!
Market fundamentals are not the driving force behind changes in price, rather it is human sentiment.
Market Behavior follows how people feel about the stock.There is a structure to it and the only way to know when to buy and when to sell, is to actually understand why prices are moving.Day-to-day (minute-to-minute) stock pricing is the result of speculation.What drives speculation?Human emotion.Prices are driven more by trader emotion than any other factor.Prices go up because of emotion, then they start to go down because of emotion, and we deal with this yo-yo effect continually.If we understand trader emotion, then we know better where to buy and to sell.
Whenever new information is published about the market, everyone begins speculating about the effect on stock prices.Just remember, prices are not driven by rational thought, rather by trader sentiment.Further, trader sentiment is driven by two emotions:Fear and Optimism.When you think about it, this really deals with a single emotion, FEAR!Manifest in two ways, the fear of the loss of capital and/or the fear of the loss of opportunity.When the first is heavier than the second, trader sell, when optimism reigns, traders buy.
In theory, stocks should return to their fair value.If you are buying a stock that is selling for less than fair value, it should go up.People study fundamentals to find the value.In reality, this is much less accurate than people realize.However, the theory does not play out in the real world.
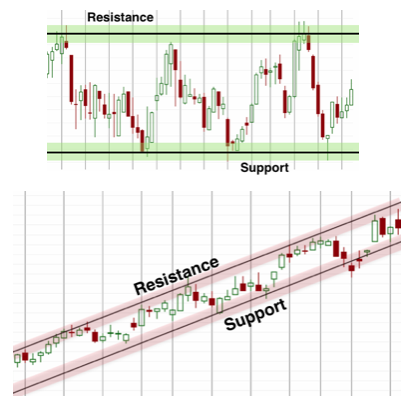
The market is surprisingly predictable, varying between support and resistance levels as shown in Fig. 4.These levels can be seen on every price chart and provide the place to begin an active trading career.These S/R patterns play out on all time frames, be it 10 minute or 30 day patterns.
Fig. 4
This is the beginning, an introduction to trading with what you see, chart patterns, forgetting the details and complications of fundamental analysis.Further training (See On-line Investing/Trading Course) (link) will show you how easy it can be to buy at support and sell at resistance, as you identify these tell-tale patterns, making repeatable positive trades.
So, when to buy and sell?It is really this simple, buy at support, sell at resistance.You needn’t spend hours pouring through fundamental information trying to guess the theoretical value of a stock.Simply watch trading behavior and follow a simple set of rules. The market is surprisingly predictable. That does NOT mean the FMP is easy to find, particularly as it changes from day to day. We must learn to work with what we see in the price charts.
Common sense becomes our strongest ally, using what we learn about Support & Resistance with several confirming factors:a) Moving averages, b) Chart Patterns, c) Japanese Candlesticks, d) Momentum indicators.You will not find a better introduction to successful stock market trading. See our On-line Investing/Trading Course, our book Provident Investing, and our tutorial on TC2000 EasyScan.