Stops: The goal is to average more on winners and less on losers.
You will find the keys to accomplish that in this link:
Learn with our products
The best investment tip ever given is this:
“Cut your losses short and let your profits run.”
Stops: The goal is to average more on winners and less on losers. If you can do that, you’ll make money if only half your trades work out. However, it is a strategy very hard to implement. But it becomes much easier keeping this strategy in mind as you evaluate chart patterns. Is there a support level not far below your potential entry point (usually a previous low)? That is where you can set a loss-cut point (aka, Stops) just below.
So, what is a loss-cut point? Before we get to that, look at this trending stock chart:
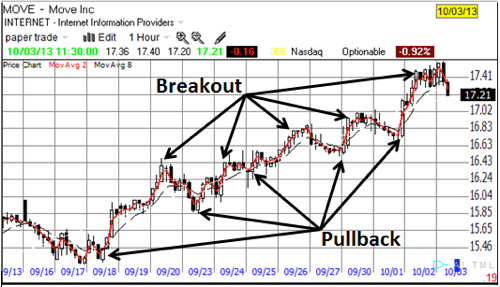
Fig. 1 MOVE – Trending Stock (up 12% in less than a month)
A trader has many choices as shown in Fig. 1. Even with no indicators to help, it is obvious the market is in a trend, with small pullbacks on its way up. Each time the market pulls back and then breaks through previous resistance is an opportunity to trade. What can go wrong?
Let’s try the example shown in Fig. 2:
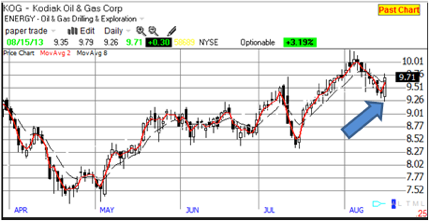
Fig. 2 KOG – Up-trend.
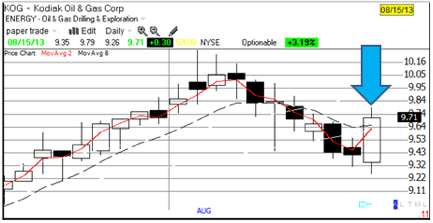
Does this look like a good entry point? It shows a decent up-trend. The pattern is much like previous pull-backs, with a strong white candle looking up. The last candle is a very bullish Engulfing pattern as shown in Fig. 3.
Fig. 3 Last Candle suggests an Engulfing pattern, very bullish.
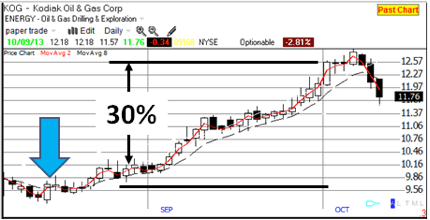
So place the order to see if our choice is correct. Fig. 4 below confirms the choice as a winner with a hefty price increase.>/h3>
Fig. 4. Positive follow through of the trade.
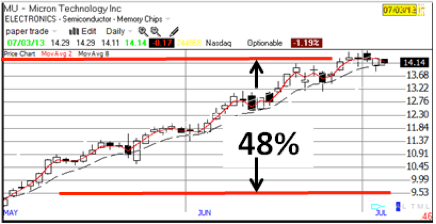
This turned out to be a great choice, gaining over 30% in about six weeks. But what signals caused us to quit at the top? How do we define a top? That’s the subject of another Guideline. But let’s try another while we feel so good! This next chart, Fig. 5, shows a hefty trend, gaining 48% in a couple of months. Does it have any strength left?
Fig. 5 Micron Technology (MU)
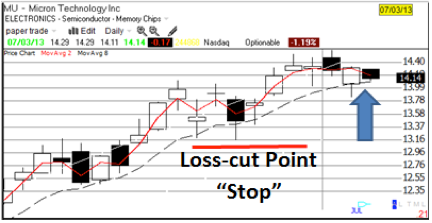
In the previous example we didn’t include any protection against the sudden drop in price which would us back. Let’s include a loss-cut point (called a Stop) just under the last minor low as shown in Fig. 6.
Fig. 6 Entry point with “Predefined Loss-cut Point”
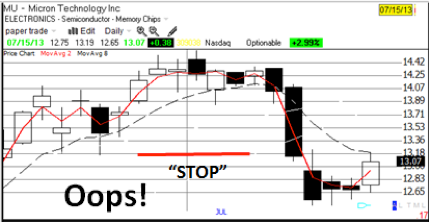
Now, let’s see the “Rest of the Story” in Fig. 7.
Fig. 7 We were “Stopped out” at the Pre-defined stop point (loss cut point).
The Stop Worked!
You can never know in advance which trades will be winners and which will be losers. The result of any individual trade is essentially random. If you planned this trade with a pre-defined loss point and the market got to that point, and you took the loss, then well done – you traded like a professional. Be happy to take your losses. They tell you that either your analysis was wrong, or your timing was out. This is important information, allowing you to prepare better for the next trade.
There is nothing unusual about getting stopped out. Review the chart. Once stopped out, was there a reentry signal? If not, who cares about the missed profits. They weren’t available for the taking. If there was an entry setup and trigger, why didn’t you take it?
There is nothing unusual about what just happened. But you can’t let any lessons get away. Analyze why you made the trade and how you managed it. This is “Risk Control“ at its best. The big difference between Professionals and the novice trader is when they take a trade. The first take their trades when they are comfortable with the risk. Amateurs trade when they like the potential profit.
There are many different stop methods which we will cover in coming Posts. Try to burn into your mind the necessity of using stops to control risk. Not using stops is like driving through town ignoring all the red lights. You may make it sometime but you know it will catch up to you. I got a chuckle when I heard this analogy: “You never know who is swimming naked until the tide goes out.” The tide going out is the severe market turndowns, don’t get caught naked.
In a word – INSIGHT!

