Invest…why? Is there a payback? The products offered and the dozens of free full tutorials answer that question!
Learn with our products
Is there any value in this trading effort? Is there a reason to spend the time required to give it a fair shake? Let’s consider the question by going back to the basics: Why Invest?
Is investing simply another form of gambling? The age-old myth that says everything (life, crossing the street, getting on a plane, etc.) is a gamble, misses the point. How about life, is life a gamble? The certainty is none of us will get out alive. Where’s the gamble? The odds are that I will never get hit crossing the street in my entire life. That’s held for the first half, 60 plus years. But there is a reason for these odds. I take precautions before crossing a street. That’s not rocket science. It does not mean it’s impossible for such an event to occur, just highly unlikely. Going down in an airplane? Possible, but very unlikely. Now, what are my odds in the Casino? We know the tables, the games, the slots are tilted toward the house. That is how they survive, how they pay for the lights, the entertainment, salaries for all the help and a handsome profit for the owners. It has to be that way. My odds of winning in a Casino are less than even. Over the long-run, on average, I can expect to lose.
Now, that’s a gamble!
So, what is a sure bet? A bet we can’t lose. If there were such a thing, it wouldn’t be a bet, would it? The idea of a “bet” suggests a wager on the outcome of some event, over which we have no control. We can have opinions about the outcome based on previous experience which may improve the odds of winning, but the idea of a bet suggests winning or losing, including some element of chance.
Let’s consider what the term “odds” means. – Odds – If I roll a fair die, it can come up with 1, 2, 3, 4, 5 or 6 with equal likelihood. That means the odds of rolling a one is 1/6, or 0.1667 (the chance of success divided by all possible outcomes… as a percentage, 16.67%). If I want to roll an even number, there are three possibilites out of the six total, so the odds are now 3/6, or 0.5 (50%). If the odds of an outcome are, say 0.8, (80%), the outcome will occur 8 out of 10 times, on average. Notice, we’ve created a probability scale from 0 to 1 (0% to 100%) where a zero (0, or 0%) is impossible and a 1 (100%) is certain. All events in life lie somewhere along this scale. What is certain? Death & taxes… Point: six rolls of a single die will not produce each of the six numbers. It is a bias, a tendency, a likelihood. If we roll the die 60 times, we will get around 10 for each number. 600 rolls and it will be even closer to 100 for each number. That is why we used the expression “on average” earlier. You can take that to the bank.
We’ll return to this idea of “odds” many times during our discussions. Consider it well!
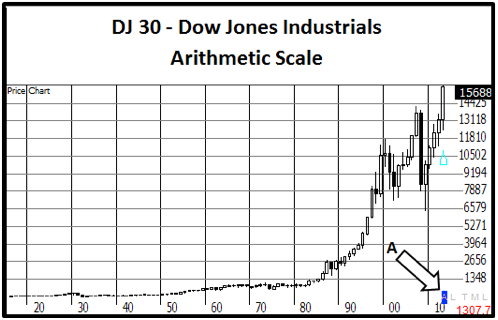
Risk What is important here is the difference between the likelihood (chance) of success and failure. The odds of crossing the street and a winning weekend at the Casino are not even remotely close. This applies, most importantly to the concept of Risk. Risk suggest danger, or the magnitude of harm that may result. If I’m hit by a car crossing the street, it could mean my life. A loss at the Casino may be an inconvenience. Sound judgments in life and in the market must be made considering the risks involved (both magnitude and likelihood). If we only considered the magnitude, we’d never leave the house. If we only considered the odds, a 10 cent bet would mean the same to us as a $10,000 bet. Our example using the six-sided die to find the odds, used numbers. This is a critical step for us to understand the dynamics of the market. Using numbers, we can quantify the risks involved. If we bet only on sure things (odds = 0.9), we’ll succeed more than those who bet on unlikely outcomes (odds = 0.1) over some period of time. The numbers, 0.1 and 0.9, are how we quantify the risk. Without numbers, risk is simply a matter of gut. Now look at what our odds are if we invest in the stock market. The chart below shows a historical record of the value of the Dow J0nes Industrial Average from 1920 to the present.

Fig. 1 A history of the DJ-30 Industrial Average (linear scale)
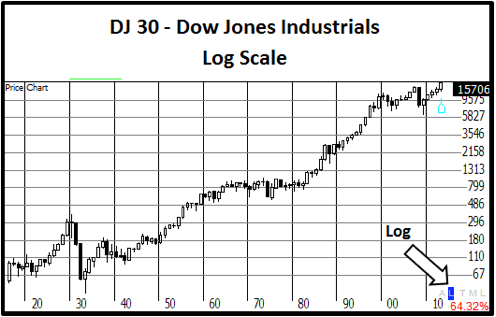
The Dow is the most popular index of the market and the one most often reported during the market day. It is considered THE measure of market activity. However, it is not strictly an “average” market indicator, being made up of 30 industrial giants, all leaders in their fields. It is an index designated to express the health of the companies represented. Had we invested $1,000 in the market in August of 1920, it would be worth over $300,000 today. That is a fact, a matter of public record. Given that record, what do you suppose the odds are of winning (increasing your personal wealth) in the market over the last 90 years? Fig. 1 above is drawn on a linear (Arithmetic) scale, meaning the vertical scale has equal divisions bottom to top. This linear scale tends to distort relative market activity. For example, back in the mid 20’s the Dow was around 95 points, then increasing to 381 before the crash in 1929, nearly a 300% increase. That dramatic increase is hidden well on this chart with barely a blip near the “30” marker. As well, the severe drop after 2000 and in 2008 may throw a fear in our gut about what might happen. A different vertical scale is shown in the next graphic which gives a better look at market activity over this same time period. This uses a Log scale where the difference between grid lines is now 60%, giving equal graphic value to the changes over this time period.

Fig. 2 Market history shown on a logarithmic scale
Pictures are always worth more than words. Charts are the pictures we use to view market activity. Different type charts help us see different things as shown in this example. But the message is very clear in any event, the odds of success in the market are clearly on our side! Careful study of these charts make one thing clear: The market goes up, the market goes down. However, the market has shown a positive bias throughout its history. Someone sagely observed, “a study of economics usually reveals that the best time to buy anything is last year.” Figure 2 confirms that observation with some noted exceptions. Investing in the stock market involves measures of risk, with the chance of loss right along side the chance of gain. The profound difference between investing and gambling, however, lies in the measurement of risk. Classic Casino gambling numerically has a risk of less than 0.5, meaning there are more ways to lose than ways to win, with no chance of winning long term. Whereas, investing in the stock market puts us into a game with the house-odds on our side. That does not mean we can’t lose. However, with an average positive bias of over 13% per year for 90 years, it means there are many ways to win!
“Man has been endowed with reason, with the power to create,
so that he can add to what he’s been given.” Anton Chekhov
