Learn with our products
Trends have been the lifeblood of all investment strategies, from buy-and-hold to day-trading, since trading in the markets began. Trend following is the mechanism to take advantage of this market principle. Without it, that is, with no change, there can be no gain or increase. The simple trend line is the most useful tool in market studies. Both up and down examples are shown in the following chart where the up-trend line (Red) is drawn under the rising reaction lows, while the down-trend line (Black) is drawn above the declining market peaks. See Fig. 1 below. Notice, the down line lies on top of the price bars, looking for a break which would be up, with the opposite for the up line.
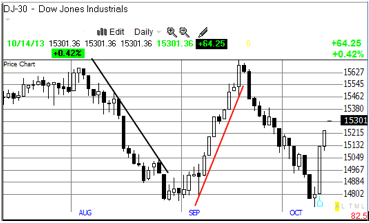
Fig. 1 Trend lines on DJ-30 chart
What constitutes a trend line? Two touches make the line, with a third touch being confirmation. The more times the line is touched (tested), the more significant it is. These lines grow stronger with each successful test (touch) – some last for years, while others last for only a few minutes on intraday charts. Fig. 2 is a good example.
T-lines contain both hidden market order (consistency) and the self-fulfilling prophecy created by market players expecting price turns at these lines. Given these two considerations, can trend lines forecast future patterns? In the long term, quite reliably. That is, many stogy growth stocks have remained on a steady up trend for months or years. What is in the future? Take a look at the past for clues.
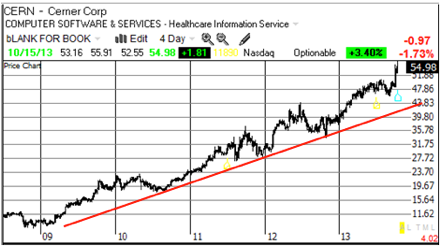 Fig. 2 Long-term Up-trend (arithmetic scale) CERN.
Is there any question about where CERN is going in Fig. 2? It would be a good time to expect a pullback, which will be a great trading opportunity. But see how the trend line confirms the consistency of this company. Is it important where the trend line touches the price bars? Let’s take a look at the same chart in Fig. 3 with a Logarithmic scale (same company, same chart).
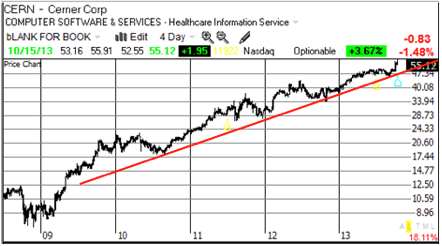
Fig. 3 Long-term Up-trend (logarithmic scale) CERN.
Same company, same time-frame but with different touch points. Let’s cut to the chase. Trend lines are really just figments of our imagination! While they appear on a chart as something very tangible, they are not. But once they are drawn on paper, or on the computer screen, it is difficult to see them for what they are – mere approximate guidelines of the trend. Price is real, trend lines are not! What does that mean for us? There is no good reason to take a trend line too seriously! There is no reason to assume that a small “violation” of a trend line has the importance of an IPO or introduction of a new product.
This is not to say you should go cold turkey and give up these lines completely. Traders with experience eyeball charts, seeing trends and lines on different time frames without drawing them. However, for those just starting out, look at trends in a flexible way and don’t expect to find scientific conclusions. Look for ascending bottoms (an uptrend) or descending tops (a downtrend). Don’t linger over every chart. And look at a lot of charts! It is by comparison that you get good at it.
As a counter to what I’ve just said, price is real only in the context of an agreement between the buyer and the seller of what price should exist at the moment of agreement. Trend lines are real in the context of what the masses of traders psychologically think prices SHOULD be, or WILL be, or where it will go! Look carefully at Fig. 4. How you each deal with this issue is at the heart of good trading. Think for yourself!
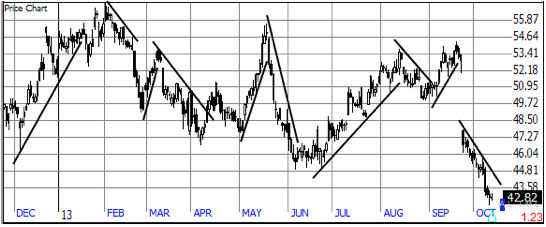
Fig. 4 Trend Lines
Remember, the trend is your friend… until the end… when it bends!
In a word – INSIGHT!