Learn with our products
Trend lines drawn on a stock chart is an art form. The reason is simple, with each trader bringing their own unique differences to the table. With so many different experiences, objectives, perspectives or points of view, we’re unable to objectively agree on the best way. It is the classic subjective arena we play in. So, why do we pay so much attention to trend lines? What is the purpose or what is our objective? Very simply, to find high probability, high profitability, entry or exit positions. Where is the most probable point for a reversal to take place. More specifically, where is the most likely place for a change in trend to occur.
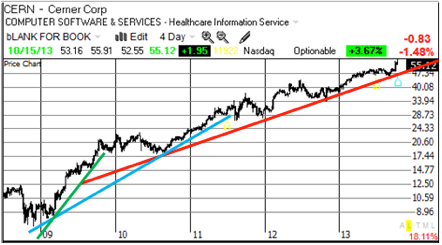
Fig. 1 The changing Trend line.
In Fig. 1, covering five years, if we started plotting trend lines during 2009, the Green-line suggested a change pending as price broke through the trend late that year. Sure enough, it moved sideways for over six months. The Blue-line highlights the next visible trend, picking up from where we left off, until a break in the trend. Moving ahead, the Red-line picks up on a visible trend which is still in force (Oct. 2013). The following chart, Fig. 2, shows the action over the most current five months with the latest trend line
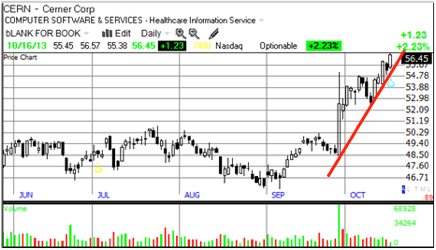
Fig. 2 Trend line for most recent months.
To punch-up the versatility of this trend-line approach, Fig. 3 is a one-minute chart showing three of the many possible trends.
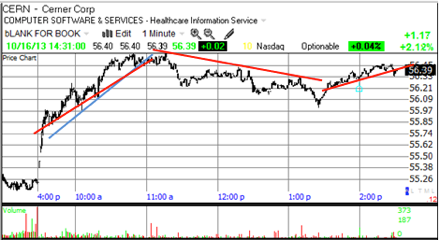
Fig. 3 One-minute chart, most recent day.
As you observe any of these charts, see if and where any trading messages appear. This is a great tool help in our decisions!
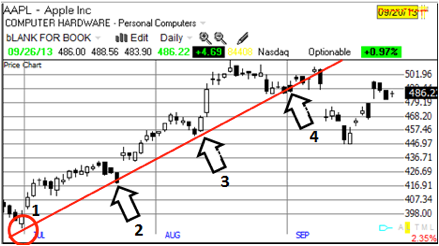
Fig. 4 Apple Computer (AAPL).
Let’s recap trend line drawing with Fig. 4, a chart of Apple (AAPL). The trend began with Points 1 and 2.
- In an uptrend, a trend line should connect the relative low points on the chart.
- In a down trend, draw the line along the highs of prices.
- It is unusual for three points on a chart to exactly coincide with a straight line connecting them. More likely, prices will be close and a best-fit line will have to suffice. This is why trend lines are as much an art as a science. The price moved up and away from point 2, finally coming back to the trend line at Point 3, the third touch.
- It takes two touches to draw a trend line, but 3 to confirm it as being as valid one. The stock found support near the line after we got two touches at Point 3. That would have been a good chance to take a position in the stock.
- A break in the trend line does not mean that the trend will change. The use of trend lines does not guarantee success. Success in any market depends upon probabilities. “Likely-hoods” are the meat upon which we feast. Trend lines increase the probability of our success as we trade. The following points can help increase the odds in our favor:
- The more times a stock touches a trend line, the more significant it becomes.
- The steeper the trend line, the less reliable it will be.
- It is quite alright to have more than one trend-line of a price chart.
At Point 4 on Fig. 4, the price pattern faltered, failing to move higher than the trend line. That should have been a head’s up that a change was taking place. The last black candle was the final trigger point to get out of your position. You would have (or should have) got out ahead of that price point.
So, what are trend lines? Lines drawn on the historical price levels that depict the general direction of where the market is heading, and provide indications of support or resistance. It is important to be flexible and redraw trend lines when necessary. It is possible to allow multiple trend lines to co-exist.
Now, trend can mean different things to different people. To the long term stock investor, trend looks ahead for the next six months to several years. To an intraday trader, trend can mean action on a five-minute basis. So the first step is to identify the timeframe you wish to trade. There are three main timeframes around trend: short, immediate and long. Generally, short term refers to a two-to-three day trend, while a medium-term trend can be several weeks to a month or so and a long-term trend refers to the multi-month direction of the market.
Notice the pattern on the end of the trend line on Fig. 4. Once a trend line has been broken, price often returns to “test” that level. If it holds, it is an encouraging technical signal and aggressive traders could use that test of support or resistance as an opportunity to enter a trade. That would not have been the case in that figure.
Real money is made on established trends. Chasing turns, trying to pick tops or bottoms is extremely dangerous and only a gamble at best. (1) Identifying the trend: As we all know, trading with market trends significantly increases the chances, or probabilities, for a trade to be successful. But “trading with the trend” is easier said than done. This approach seems very straight forward until you need to break down the trend time frame. The yearly, monthly or weekly trends can be moving in different directions and it is important that you only choose candidates that have internal forces working together.
The longest time frame IS the overriding trend that must be respected as the driver of direction. (2) Trading Breakouts: The price breakout strategy looks for new highs/lows on a monthly, weekly, daily or minute interval basis and the high odds of the future continuation of this momentum strength. The beauty of trading breakouts is IF new highs or lows are NOT achieved you have zero risk because an entry had not been triggered. The elimination of anticipating what the market is going to do by only trading real breakouts saves money and aggravation from countless frustrating false moves.
“If you don’t know where you are going, you might end up someplace else.” Yogi Berra
Learn how Options traders magnify their leverage in our book “Provident Investing.” Get the Traders Edge!
In a word – INSIGHT!