Learn with our products

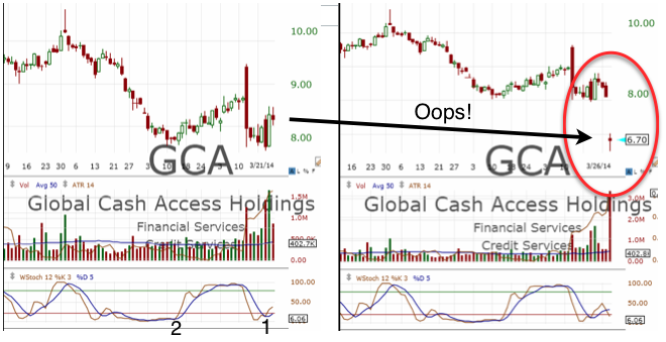
Stochastic in Hiding. BEWARE THE “OOPS!”

stochastic

The Stochastic is crossing up nicely through the Oversold 20 line (red) at point 1 in the chart on the left.

The price SHOULD follow the uptrend…
However, the Stochastic is an indicator, derived FROM the price action.

THE STOCHASTIC DOES NOT MAKE THE PRICE DO ANYTHING!

RATHER, PRICE DRIVES THE STOCHASTIC.

PRICE WILL DO WHAT IT WILL DO!

So why do we value the stochastic indicator? Because it USUALLY suggests a near-term increase in price action as shown at Point 2!

The LESSON?  Beware the “Oops!”  Protect yourself with adequate Money Management:

  •      Always use Stops!

  •      Never commit more than you can afford to lose on a trade.

  •      Trade from a PLAN of your own making.

  •      Follow your plan!

Price and volume data play a large role in explaining the curves and wiggles we see on the price charts. The stochastic plays an important role as we look for messages and direction in our trading plans. How we interpret these signals help us peek behind the curtain to predict outcomes. Predicting future price movement is the goal, while reducing risk along the way separates winners from losers.

The stock market is manic-depressive which helps explain why the perfect predictive tool does not exist. However, patterns repeat themselves in ways that help predict price movements. Proper use of these patterns and indicators reduces risk, increasing our chance of making money in the market. “Happy-go-lucky” is replaced with tools to recognize opportunity and fend off impending disaster.

The major reason they work is tied up in the collective mindsets of the thousands and even millions of traders, all looking at these signals at the same time, reacting in predictable ways. For example, if the stochastic indicator crosses up through the oversold 20 marker, and several hundred thousand traders see and react to this signal, they will trade in a manner to perpetuate the signal. And most of the time it will work. Mr. Market will throw enough curves like the example above to separate winner from losers.

On another vein, the support and resistance levels we all depend on derive from the same self-perpetuating mentality, drawing us in as we look to get in at support and out at resistance. Does it always work? Enough to keep traders in the market, some of which make money…

These levels have an interesting and important affect on the minds of traders. When the stock price moves up to the ceiling (resistance level), traders see the price less likely to go higher and begin selling the stock. Additionally, a trader who is considering the stock will probably see it as overvalued (over-sold) and delay his investment. Both of these mind games become a self-fulfilling prophecy and indeed, the stock does decline. The same scenario repeats itself when the stock falls to its support level, with traders willing to buy-in since it looks ready to increase.

This channel created by levels of support and resistance remains in effect until some strong market activity causes a breakout on either the upside or the downside. Rolling stocks demonstrate the action of support and resistance quite dramatically and show how we take advantage of this market phenomenon.

The indicator covered in this post, the Stochastic, is a technical oscillator that senses when buying is slowing down at the top, and when selling is waning on the bottom. The Stochastic is the Red line with the Blue a smoothing moving average of the Red. When Red crosses up through the Blue, a buy signal is the call. With the Red crossing down through the Blue, selling predominates and its time to sell. Oversold and overbought signals are 20 and 80, as shown. A lot of normal action occurs between these two values, without sending us action signals. Learn to use and take advantage of the Stochastic!

SiteMap

What is the Traders Edge?
Insight!