Learn with our products
Provident Investing book, and Course opportunities.
Balance of Power: A common phenomena in the market is termed accumulation and/or distribution. These two terms refer to a systematic buying or systematic selling program over days, weeks, or even months. This is not simply buying and selling. These are very large systems, usually driven by well informed institutional investors. There is no way to tap into the mentality of those parties, why they are acting in that manner or just how accurate their results are. We can know quite accurately, however, that these programs are taking place.
(Balance of Power® (BOP) BOP is the exclusive intellectual property of Worden Brothers, Inc. It was developed by Don Worden, a leading technical inno vator and writer dating back to the nineteen fifties. In 1994 he was the recipient of the award for significant contribution to technical analysis, given annually by the Market Technicians Association.)
TC2000 provides an excellent detector of these programs called the Balance of Power (BOP). Because these systematic programs occur over time, trying their best to not move the price up while accumulating stock, BOP is not a reliable short term indicator. Price movement has little affect on BOP. It is because of that character that the BOP has an incredible ability to contradict the direction in which price is moving.
Balance of Power (BOP) indicator tells you whether the underlying action of stock movement is characterized by systematic buying (accumulation) or systematic selling (distribution). The single most valuable aspect of BOP is its remarkable ability to contradict price movement. That is to say, BOP has the ability to go down, while the stock pattern is increasing. This action is termed a divergence.
Balance-of-Power is capable of outright contradiction! Where price might be attaining new highs, BOP may very well be attaining new lows, moving in the exact opposite direction. While BOP is plotted above and below a zero line, it is not an oscillator. It does not follow price but goes its own way. When the indicator is above zero it depicts systematic buying. When it is below the line, it reveals systematic selling. BOP is printed in colors to make the signals easier to read. Green designates significant buying, red signifies selling, while yellow reveals no dominance of either buying or selling.
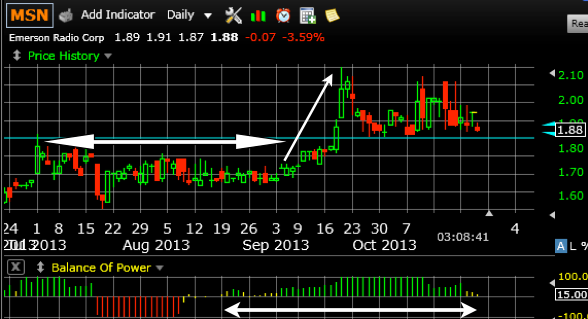
 Fig. 1 Balance of Power (BOP) signaling a price increase.
In Fig. 1, there was little price change through the end of August, then BOP began to detect systematic buying, helping to show a coming price increase. Was the BOP increase the cause of the price increase? If that were true, why wasn’t there larger price increases and decreases in July and early August? The lag in BOP messages and price action mentioned above places this indicator not as a quick return on price action. Rather, what BOP does so very well is suggest when there may be a Change in the making! Faster indications of price change are housed in many other indicators we study; TSV, RSI, Stochastics, MS, etc. Fundamentals of these other indicators are given in our book Provident Investing. See the link at the end of this guideline. Balance of Power (BOP) must be considered as but one of the tools of technical analysis. It sets it apart from all the others in its unique ability to contradict price action. See Fig. 2!

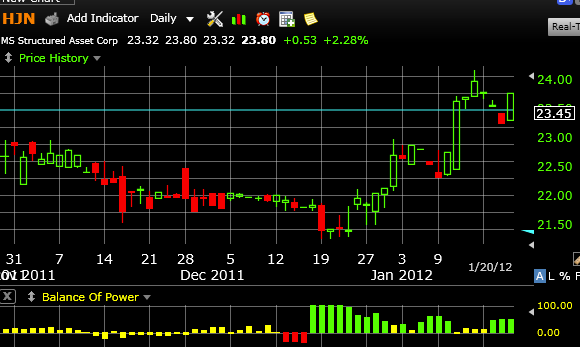
Fig. 2 How a Change in BOP suggests a change in price.
In Fig. 2, not much BOP until about Dec. 18, when strong systematic buying kicks in. Notice what happened to price some five or six days later! Appreciate the messages that accompany a Change in Balance-of-Power!

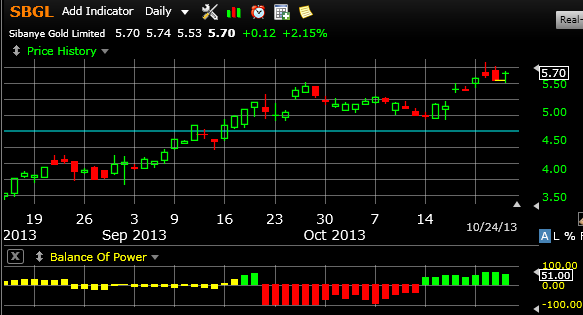
Fig. 3 Change in direction, negative, forecast by BOP.
Fig. 3 portrays a healthy up-ramp, until negative BOP suggested a change was coming. Change it was, leveling off for a coupleof weeks, until green BOP showed up a few days before the ramp resumed.
The BOP messages we receive relate to the “Quality” of a trend. They are not pin-point timing signals, rather they assess the quality of the underlying trend. The vital Risk/Reward ratio of a trade or investment may be colored or shall we say modified by the BOP message. The critical supply/demand balance may or may not be in our favor after assessing the BOP message. In short, the BOP will help you spot changes in character in a stock’s action. It must be used as one of the cadre of technical indicators.
But what are the problems, the difficulties with Balance of Power? Consider where it gets its information! Like every indicator on the books, there are only three inputs, Price, volume, and time. It is the combinations of these inputs from which all indicators are derived. The source of these three inputs is the market, consisting of all the inconsistencies, the delays, the anticipations and at times even false information. This is to say there is not a perfect indicator. What are we to do? We cannot depend upon a single indicator or even a combination of indicators. We can take as much input as possible, noodle it, let it cogitate and then make an informed decision! That is what trading is all about.

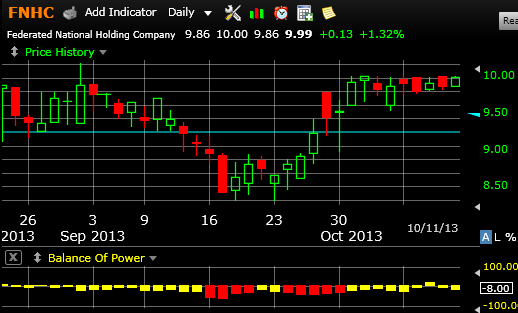
Fig. 4 Rise in price in the face of negative BOP.
Fig. 4 demonstrates an inconsistent example. If we made a decision to hold off on a trade on the 23rd, without BOP support, we could miss a 15% move in about a week. Remember the time frame for which BOP is designed. Don’t try to use it for short term trades.
For scanning purposes, that is to set up scans looking for Balance of Power levels, Green represent values greater than 30, while Red measures those below -30, and Yellow all those in-between. As with all other indicators, check BOP in a variety of time frames, for example, daily, weekly and monthly. Don’t get caught uninformed about what is happening across the landscape! Be sure to include other indicators.
The size or amplitude of BOP has little or no significant correlation with the extent of any following move implied. They do, however, have a significant correlation with the reliability of implied moves to follow in terms of direction. The best indication of how far a stock is likely to move is the volatility it has shown in past moves. Always pay close attention to the history of a particular stock pattern.
-
Note: Many other TI’s are available to help us get into and out of positions ahead of the crowd. When Worden’s TC-2000 indicators are properly used in concert with other indicators shown on the Master Overbought/Oversold Indicator Summary in chapter 5 of “Provident Investing,” you have real power!
We hope this series on technical analysis will help each of you find a new understanding of what it takes for success in the market and the confidence to take action. There are no certainties, no magic bullet or scheme or system that will allow us to escape the risks of the market place. All any of us will ever have are educated guesses about what a stock will do next. It is the level of that “educated” guess we are trying to improve, increasing the probability of success.
In the real world we can’t know with certainty what direction a stock will go, but we must have an opinion, a hypothesis, for only in trying and in having success or in making a mistake will we ever learn life’s (or the market’s) lessons. It has been said that trying doesn’t increase the risk, it reduces it. May we find joy in our efforts.
Be diligent, take action…SiteMap
“The price of success is hard work, dedication to the job at hand, and determination that whether we win or lose, we have applied the best of ourselves to the task at hand.” Vince Lombardi
In a word – INSIGHT!

